Debt and Solvency Ratios

Introduction
Solvency is the ability of a company to meet its long-term financial obligations. This ratio group is concerned with identifying absolute and relative levels of debt, financial leverage, and capital structure.
These ratios allow users to gauge the degree of inherent financial risk, as well as the potential of insolvency. Financial risk is a relative measure; the absolute amount of debt used to finance assets and operations is by itself not that meaningful. In other words, there is no right or wrong amount of debt. The company may be evaluating in context of ability to carry or service liabilities.
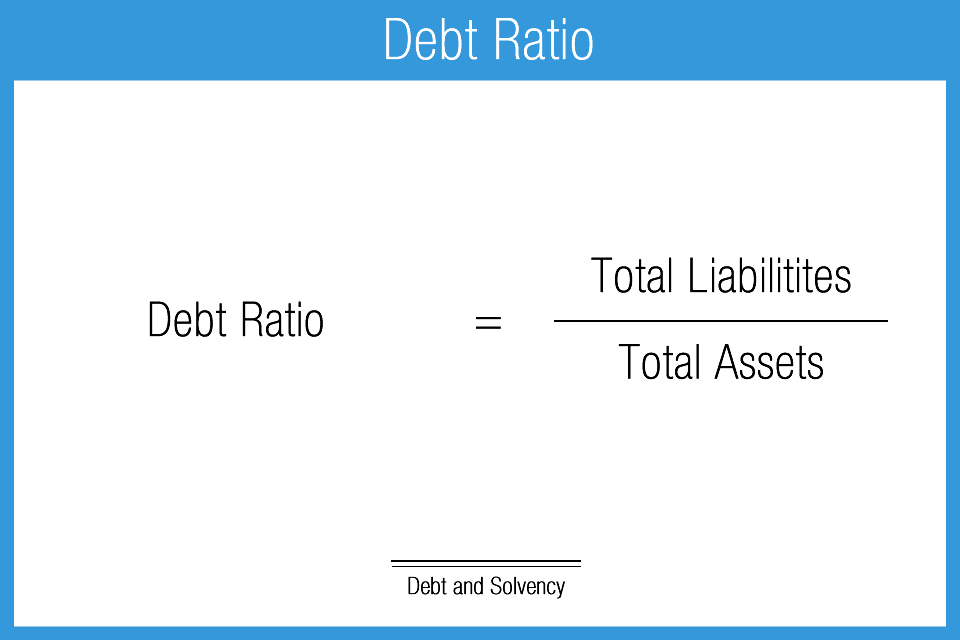
Debt Ratio
The debt ratio is the most basic indicator of solvency which identifies the percentage of assets that are funded by liabilities. There is no set rule for the result but one could expect to see a rough range of results between 60%-80% across a broad spectrum of most industries. Financial institutions conversely are highly leveraged and ratios with results of 90%+ are common. Ratios below 50% are infrequent, with the possible exception of small family owned businesses.
This ratio by itself is not especially important. It tells the level of debt or leverage, but the result needs to be considered in relation to the enterprise as a whole. High leverage can be positive if the company is able to support and take advantage of it. This ratio is therefore a starting point to solvency analysis. Analysts will quickly move on from this point by focusing attention to the composition of liabilities, earnings, cash flow, and coverage.
- Measures the relationship between total liabilities and total assets
- Basic indicator of risk, leverage, and solvency
- Favorable: lower result
- Lower results indicate a higher percentage of equity employed to fund or support operations
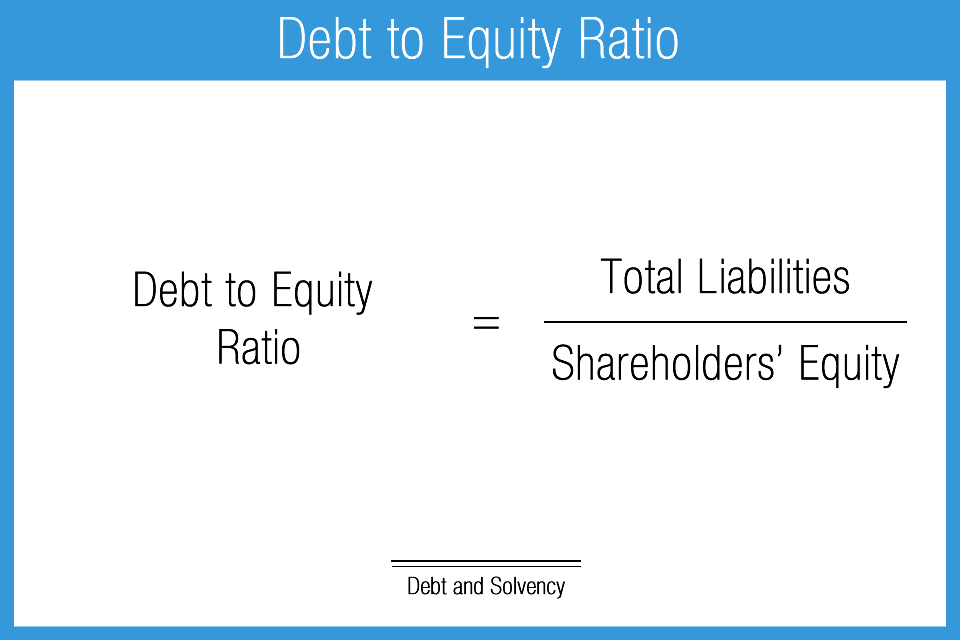
Debt to Equity Ratio
The debt to equity ratio provides a different perspective on the manner in which a company funds its assets. It is a measure of leverage and a preliminary indicator of solvency. As with the debt ratio, there is no standard generic benchmark from which to judge all companies. This metric should be considered in large part by the industry type being analyzed while performing quality peer group analysis.
Trend analysis (comparing company results over a number of years) is also helpful in understanding debt to equity ratio. Should the ratio results rise over time, for example, this trend would likely suggest increased use of bank financing or worse, signal operational issues. Such a trend would require further attention and investigation.
- Measures the relationship of total liabilities to shareholders’ equity
- Indicator of financial leverage
- Favorable: lower result
- Lower results indicate less risk in operations
Equity Ratio
In almost all cases, a strong equity to assets ratio is a positive sign, especially from a risk or solvency perspective. A high equity ratio is generally a common trait of quality, well performing companies. The equity ratio by itself, however, does not explain how the level of equity was achieved. A high degree of equity can be present for a variety of reasons, from seed funded startups to long-running, historically successful companies with significant retained earnings. Another possible event that could distort the usefulness of this measure could be a large secondary common stock offering.
Lower relative amounts of equity can occur simply for industry-specific reasons such as the case with commercial banks or investment brokerages. This result could be also driven by an over-leveraged capital structure (too much debt) or net operating losses. As is often the case, it’s important for the analyst to get to work in order to understand the “how and why” behind the ratio result.
- Measures % of total assets financed by shareholders’ investment and retained earnings
- Indicator of leverage and solvency
- Favorable: higher result
- Peer analysis helps to qualify this measure because different industries can employ different capital structures
Capitalization Ratio
The capitalization ratio is a key identifier of financial leverage, or operational leverage which can be broadly thought of as financial or investment risk. In general, higher results indicate higher risk; lower results equal less risk. At the same time, however, higher results can equal higher returns, and vice versa.
It is difficult to assign a normal or expected range of results for the capitalization ratio. There is really no hard or fast rule because capital composition decisions are influenced by many factors including industry type, development stage, management philosophy, prevailing economic and monetary conditions, and other factors. Key to evaluating this ratio is to simultaneously understand how well the company can manage leverage.
Leverage has both risks and rewards. High leverage allows for greater returns on shareholder’ equity investment and is therefore beneficial, especially in good economic times. Conversely, when a company with high leverage is struggling, whether because of operational, competitive or general economic reasons, leverage can become a problem because required debt payments can be more difficult or even impossible to meet. Inability to service debt requirements could potentially lead to serious problems such as cessation of operations, bankruptcy, insolvency, liquidation, and restructure.
Industry type will generally influence the result. Capital intensive industries typically finance their long-lived property, plant, and equipment (PP&E) which thus increases the relationship of debt to capital. This metric will have little use for industries with little or no physical infrastructure.
- Measures the relationship of long-term debt to capital structure
- Indicator of financial leverage
- Evaluation depends on industry and perspective; generally, the lower the better
- Lower results indicate less risk in operations
- Strongly influenced by industry type
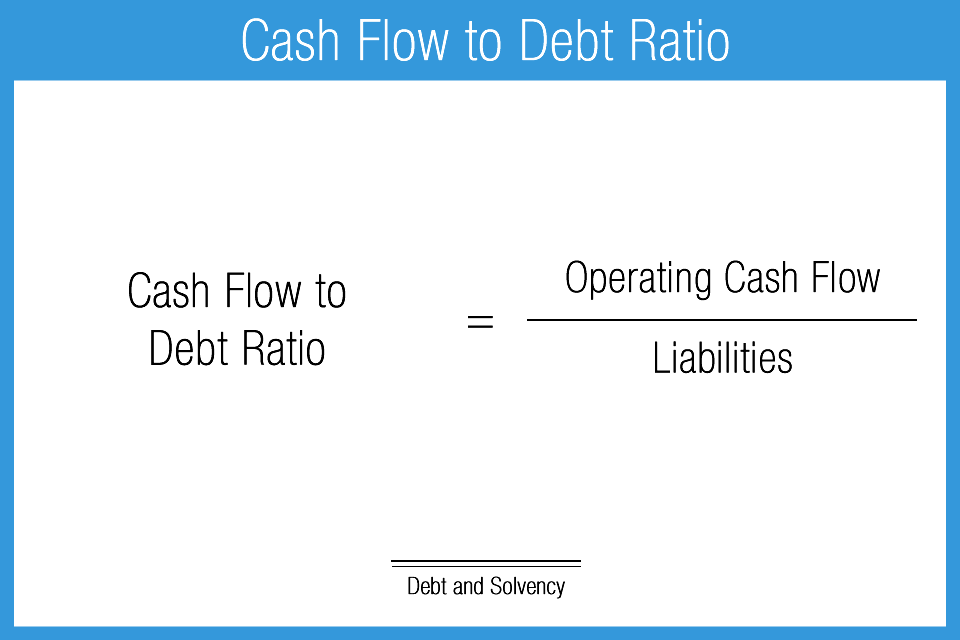
Cash Flow to Debt
Cash flow to debt is a broad, top level indicator of solvency. Cash flow to debt compares the relationship of operating cash flow to total debt outstanding. This ratio is technically different from the debt service coverage ratio because it demonstrates a company’s implied capacity to retire debt principal, or, in other words, to make payments above and beyond contractual minimums. Higher resulting ratios are generally better. However, one point to consider is that if the ratio is very high, it may indicate that management has not been employing cash in the most effective manner.
Cash flow to debt may be a slightly overstated measure because the numerator includes total cash flow from operations. In some cases, not all operating cash would be available for debt retirement. To combat this, some analysts will take this ratio a step further by adjusting the numerator to remove known anticipated cash expenditures. For example, upcoming capital equipment purchases may be removed. Further adjustments to this or other ratios are the hallmark of a competent analyst or ratio user.
Important to note is that all relevant or related categories of total debt may be adjusted for a variety of things, such as: mandatory principal reductions on interest-only financing, redeemable preferred stock or applicable portions of the principal on non-cancelable operating leases, and anything that is industry specific.
- Measures relationship of cash flow to total debt
- An indicator of solvency
- Favorable: the higher the better, within reason
- Generally less than 1:1
- Lower results indicate less risk in operations
- Not a direct indicator of debt service capacity