Profitability Ratios

Introduction
Profitability is a measure of net earnings, relative to components used to generate earnings. Profitability is also a measure of efficiency, providing evidence for how well a company utilizes things like assets or equity in order to generate both revenue and profit.
Measuring or evaluating profitability is important for gauging the quality of a company, as well as providing a basis for valuation as an enterprise or investment. Investors are especially concerned with profitability measures.
Despite being influenced by accounting conventions, earnings are still the most relevant and popular indication of a company’s ability to make money. Profitability ratios are important for defining the quality of a company’s earnings stream, and shed light on a company’s ability to generate cash.
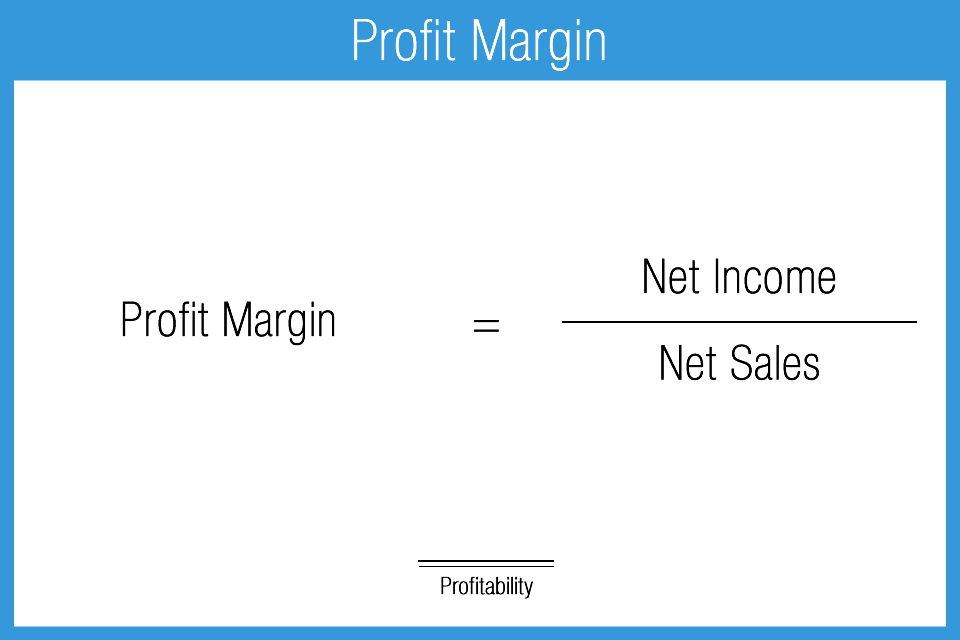
Profit Margin
The profit margin ratio is an important measure and point of consideration for any user. It measures the total profit of a company relative to total sales. Expected ratio results can vary widely by industry type (for example, banks have very low profit margins). A negative result means the company reported a net operating loss for the period being analyzed.
This ratio is often expressed on a “net” basis, and referred to as “net profit margin”, and the denominator is generally expressed as “net sales” which rightly adjust total sales for any returns, allowances and discounts. There is no absolute benchmark and it is best to compare the ratio result to a relevant peer group in order to make a proper determination.
The main drawback to this ratio is that it does not explain the quality of the result. For example, if the result is low, the user does not know if the problem lies in high cost of goods sold, or high overhead or low sales volume, or other factor. Additional research is usually required to fully understand a ratio result.
- Measures the degree of profitability after all direct or operational expenses
- Usually calculated after the impact of net interest income / expense
- Also known as pre-tax margin
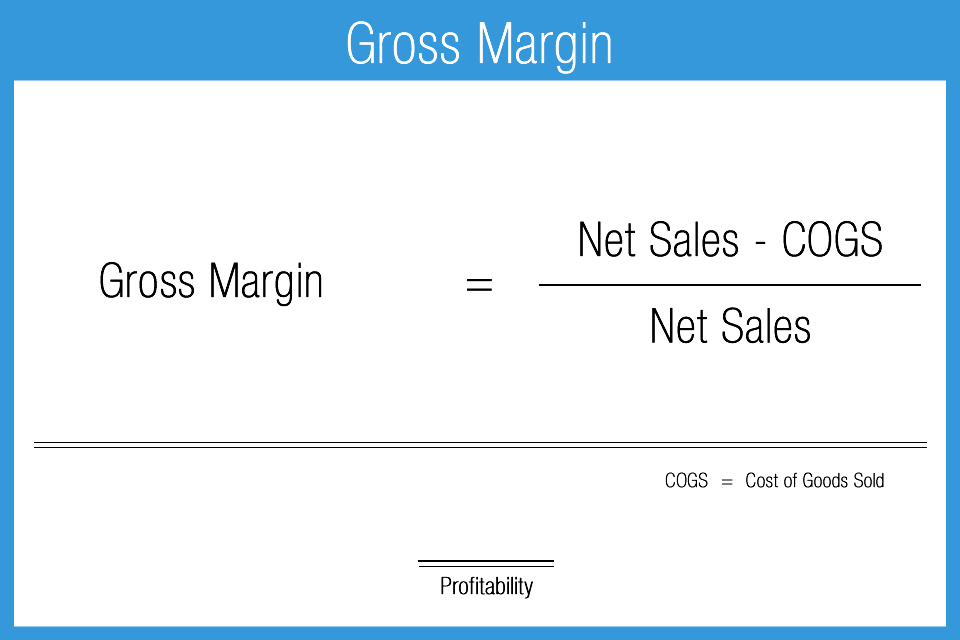
Gross Margin
Gross margin measures the relationship between sales and cost of goods sold. It is the first available measure of profitability on the income statement, specifically measuring the profitability inherent in a business before applicable overhead costs. A high gross margin is a welcome sign, indicating that production revenue is well in excess of total direct production costs. A low gross margin is cause for concern and further investigation. Peer group analysis will shed important perspective on this result.
The ratio can often be expressed in terms of “net revenue” as well, meaning gross sales less returns, Allowances or Discounts. This ratio should always result in a significantly positive number. If looking at interim statements, keep in mind that the gross margin can be affected by seasonality. Using annual statements will mitigate this possibility. The ratio is mostly relevant for companies with significant manufacturing activities such as an equipment producer or re-seller. This would not apply to service sector companies such as accounting or law firms that have no significant cost of goods.
- Measure of cost of goods sold (COGS) relative to revenue
- Most relevant for inventory based businesses (manufacturing / retail sales)
- Best evaluated relative to similar companies / peer group
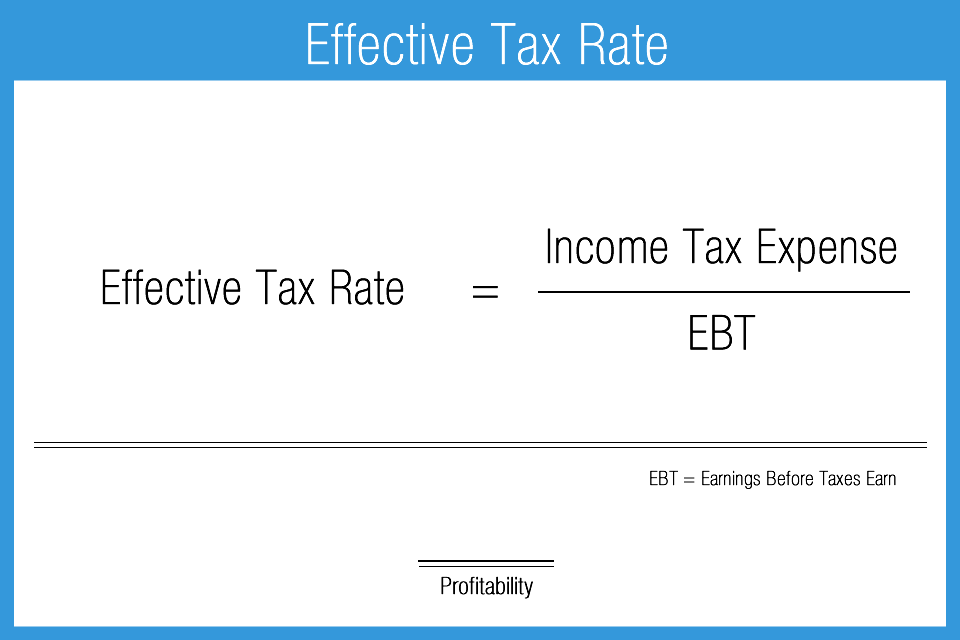
Effective Tax Rate
The effective tax rate shows the overall relationship between income earned and taxes paid. It does not reflect or demonstrate effects of tiered taxation rates. A potential limitation of this ratio can be the composition of the numerator. For example, the analyst should (or can) investigate further to determine the impact of any non-recurring tax loss carryforward that could serve to reduce actual taxes paid. This is important if one is using historical results as a basis for building financial projections, or simply looking to estimate cash flows using a forward perspective.
Effective tax rate can be applied differently depending on user needs. If the user is charged with evaluating a new potential line of business and its net earnings impact for example, it may likely be more accurate to use marginal tax rates. Use of the marginal rates may best determine tax implications resulting from the anticipated marginal earnings increase. To interpret this variation, compare the result to applicable standardized tax schedules and compare to peer groups.
- Measure of income tax paid relative to net income
- Calculation of tax rate at a given time period
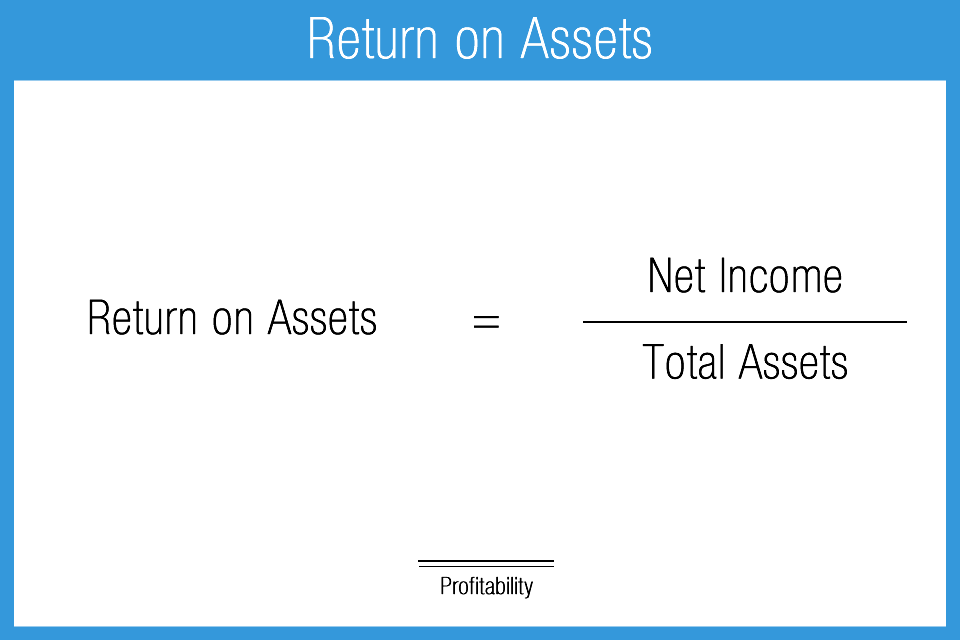
Return on Assets
The return on assets (ROA) ratio measures relationship between net earnings and assets. The result varies greatly between industry types, generally because of balance sheet composition. Capital intensive industries such as utilities or automobile manufacturers generally will report lower ROA numbers compared to service firms such as law offices or software developers. Manufacturing industries require expensive equipment which appears as an asset on the balance sheet and therefore not comparable to service based businesses. Peer analysis is therefore important when drawing conclusions.
Capital structure can have a significant impact on ROA and therefore analysts may add back interest expense to net income, especially when conducting peer analysis. This measure can also be calculated on a pre-tax basis, and often is, especially when comparing a company to a peer group. Many analysts consider this less of a measure of profitability than a measure of operating efficiency because it also indicates how well a company is employing its assets to generate profits.
- Measures relationship between net earnings and assets
- Indication of operating efficiency
- Favorable: higher result
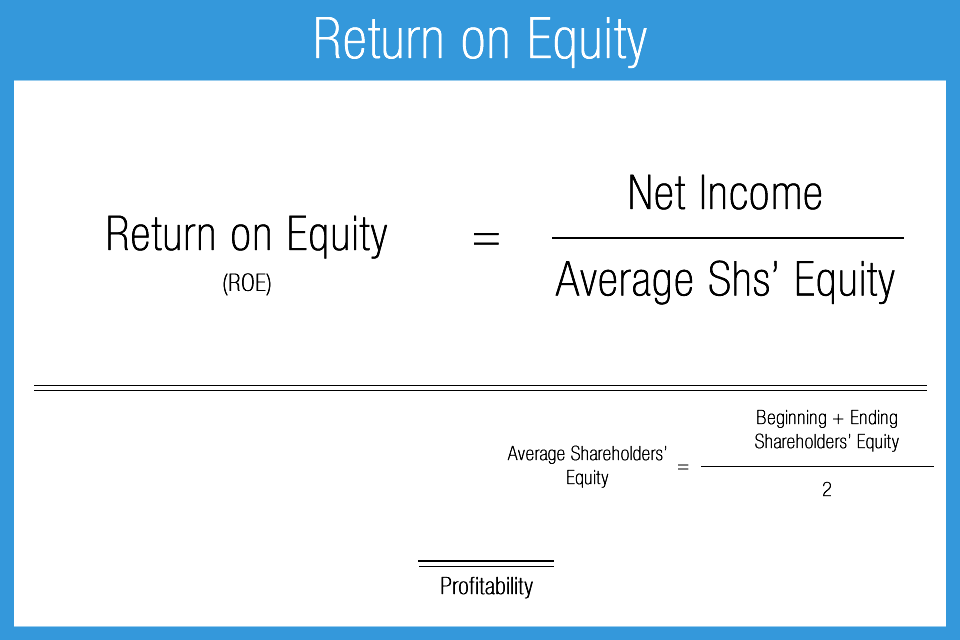
Return on Equity
Return on equity (ROE) measures profitability relative to shareholder investment, or equity. This ratio is generally considered the best measure of profitability and is strongly favored by investors. While always important, users such as lenders or creditors are less concerned with this ratio given their focus on risk of being paid back. As with return on assets, it is best to use average equity in the denominator for the period being analyzed because equity levels can change during the period.
Capital structure and financial leverage heavily influence ROE results, both within and between industry groups. Companies that use higher levels of long-term debt will generate have higher ROEs (all things equal). Higher leverage can also indicate a higher degree of risk associated with generating earnings.
- Measures relationship between net earnings and business equity
- Indication of operating efficiency
- Favorable: higher result
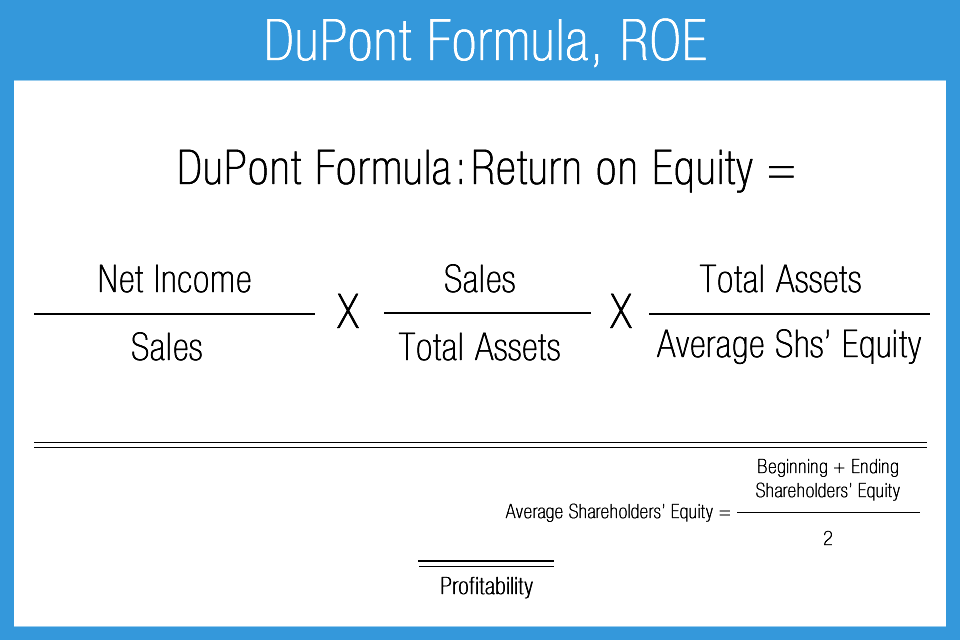
DuPont Formula
The DuPont formula is an alternative approach to evaluating return on equity, effectively splitting the traditional ROE ratio into three significant components: profit margin, asset turnover and financial leverage, to better understand changes in ROE over time using trend analysis.
The purpose is to isolate or breakout these three drivers to get a better idea of which component has had more impact on the change in ROE from the prior period. For example, learning that profit margin was the reason for the increase in ROE over the prior reporting period is a positive sign. Conversely, if the increase was attributable solely to an increase in financial leverage (increased long-term debt) then that could be considered negative.
Generally there is no standard benchmark for this metric. In terms of the calculation result, the higher is better, just like with the conventional ROE Ratio. More importantly is the ability of this ratio to look beyond conventional ROE. Comparability between similar industries, timeframe, and other context is particularly important when employing this formula.
- An alternative approach to evaluating return on equity (ROE) to provide further insight than just the standard ROE measure
- Splits the traditional ROE ratio into three components: profit margin, asset turnover, and financial leverage
- Favorable: higher result
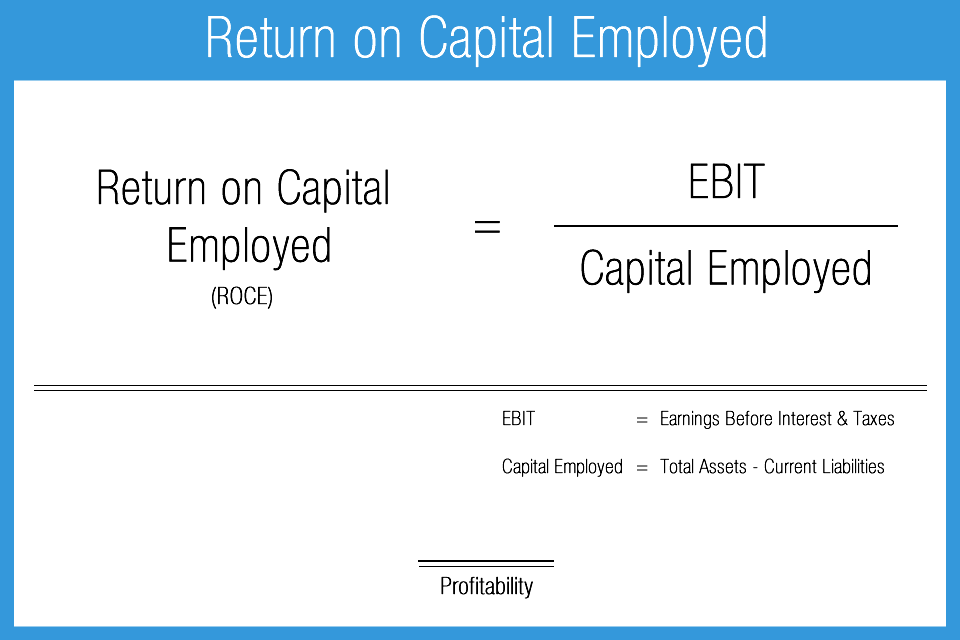
Return on Capital Employed
Return on capital employed, or “ROCE” is a similar measure to return on equity, but gives more consideration to the effects of debt and leverage relative to earnings. It is therefore especially helpful when evaluating highly-leveraged or capital-intensive companies. ROCE is potentially better and more accurate than standard ROE because it attempts to indicate how well a company is generating earnings in relation to both debt and equity.
An important consideration is that the ROCE ratio should be greater than the company’s weighted-average cost of capital; if it is not, then this is a signal that over time earnings from operations may be steadily declining, resulting in less earnings available to shareholders.
One general drawback is the total assets in the denominator which includes the effects of depreciation and amortization. This can serve to reduce the denominator and artificially increase the ratio result. This scenario could skew results between new and older companies, so one should consider this potential issue.
Trend analysis is beneficial when using most ratios, but especially so for ROCE. The analyst should hope to find year to year increases in ROCE which would indicate the company is in fact benefiting over time from its efficient employment of capital. This cannot be determined from looking at a single reporting period.
- Measures the relationship between earnings before interest and taxes (EBIT) and shareholders’ investment
- Indicates profitability and efficiency
- Favorable: higher result
- Higher results indicate more efficient use of capital