- Accounting Topic
- Financial Ratios Topic
Benefits and Limitations
Benefits
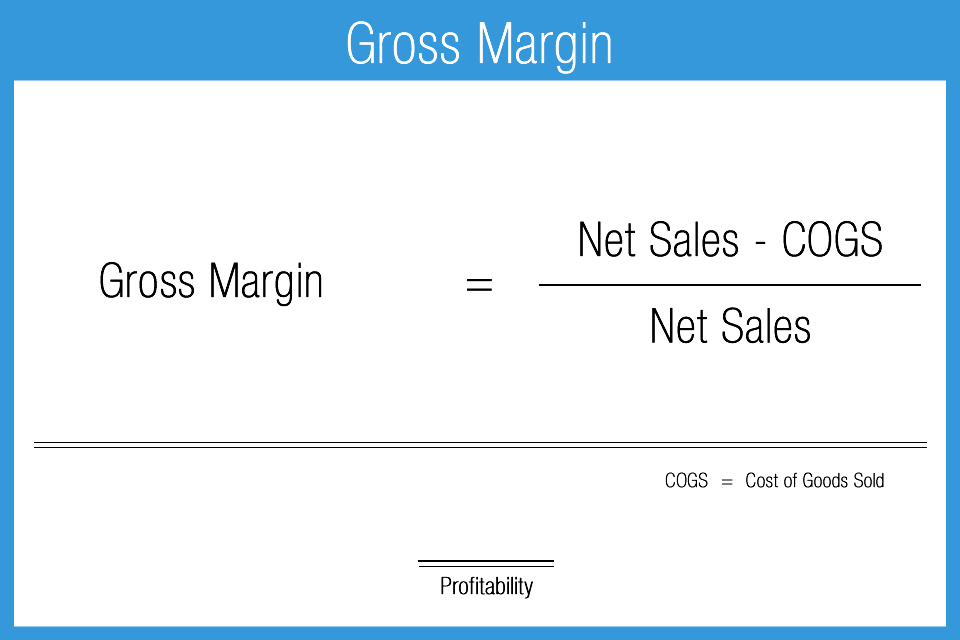
Financial ratios are designed to provide users of information useful metrics to evaluate business activity and health. The results provide a quick and consistent methodology for digging into somewhat complex data and providing helpful insights to facilitate decisions. Projections (educated financial guesses about the future) may also be made based upon historical results and the corresponding ratio. For example, a stakeholder could use the current gross profit margin to project gross profit in the future based upon revenue estimates.
Different stakeholders can benefit from different benefits of ratio analysis. The concepts apply to both internal or intra-company analysis as well as inter-company or peer analysis. Comparing a company’s financial ratios to a peer group is a standard analytical practice that helps give a basis for understanding company-specific ratios. By using a relative comparison to a group of companies operating in similar business lines, an analyst can form conclusions to help decision making. Comparisons are useful when in the same peer group in terms of the products or services offered, size, and structure. A big publically traded software company will be best compared against another big publically traded software company, and so on.
Limitations
Ratios are based on historical information and history is never guaranteed to repeat itself. Historical data can sometimes also include unusual or nonrecurring activities that may not be present going forward. Ratios without context generally have limited value to stakeholders. A video cassette rental company, for example could have strong financial ratios, but be put out of business almost overnight with the release of DVDs and internet streaming. Financial ratios by themselves may not indicate such an abrupt change and therefore must be interpreted along with other circumstances.
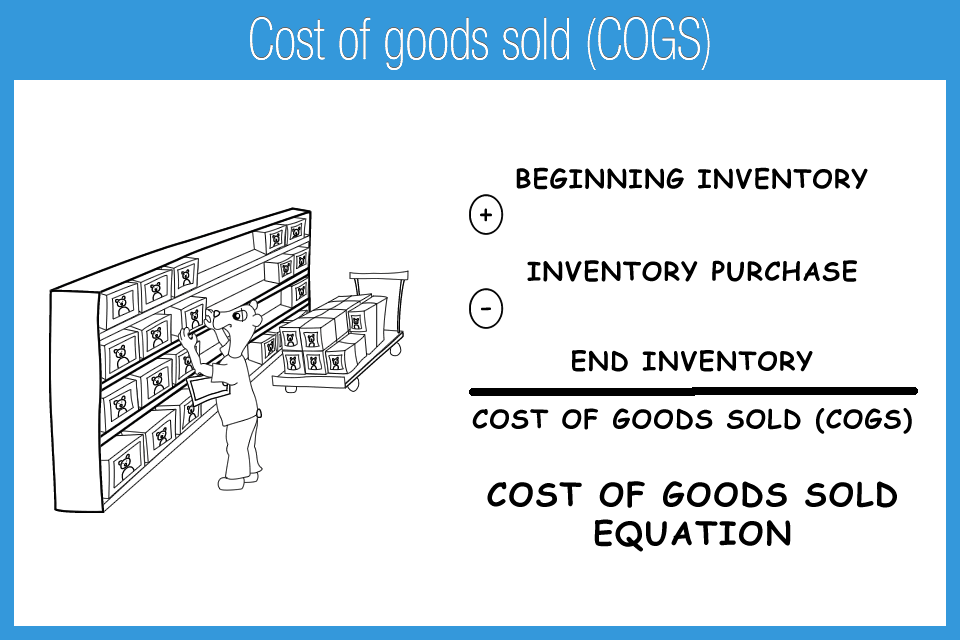
Ratios should be combined with other outside data points. Using gross profit margin to predict future cost of goods sold based on revenue, for example, is logical but dangerous if other circumstances are not considered. The ratio itself will not tell the analyst that current prices may have doubled due to supply chain issues or political problems, for example. There have been many companies with strong financial ratios that subsequently failed due to internal and external circumstances.
Ratios provide insights into business metrics, but typically require further analysis to be valuable. A competent financial analyst understands that ratios often create more questions than answers and will increase the scope of research and analysis where appropriate. Financial analysis starts are the numbers, but takes into account other factors outside the balance sheet and income statement. The notes to the financial statements for example can be a very important area of analytical information that provide clues to the accounting methodology, lawsuits, plans, and other required disclosures. Micro and macro political and economic trends will also factor into analysis, such as new law or interest rate changes.

Balance Sheet
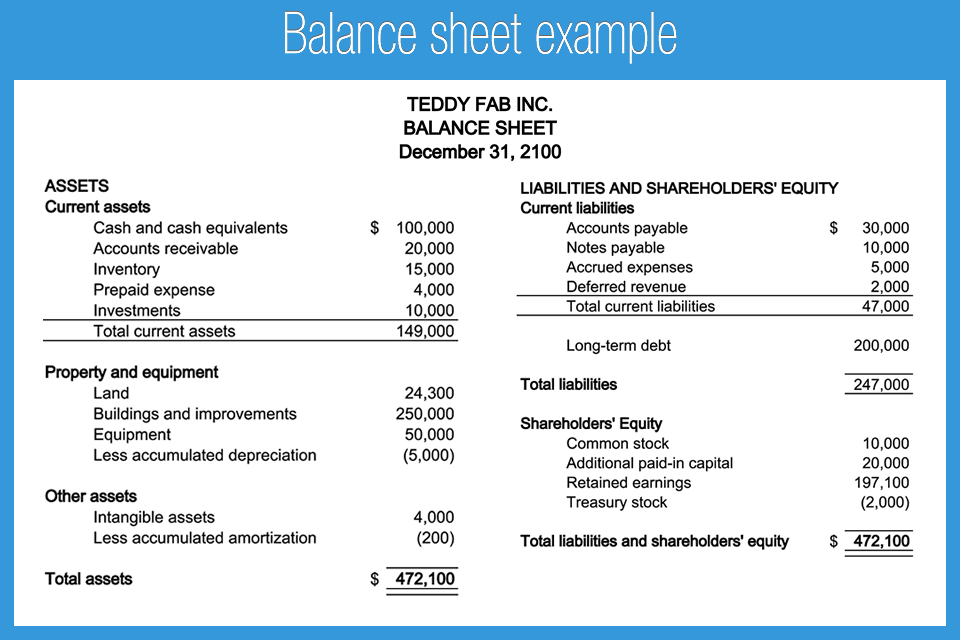
Ratios provide information at a single point in time or time period. Ratios that use balance sheet accounts will be at a single point in time, because the balance sheet accumulates transactions up to a point in time. For example, cash is a balance sheet account that is specified at a given date. An analyst must pick a point in time that is relevant for the given analysis, such as December 31, a typical calendar year end. If only one point in time was analyzed the results might not be useful unless compared to several other time periods. Cash, for example, at a given date could fluctuate due to many circumstances such as: financing, investing, or operating changes. Financial analysts will therefore draw on different time periods for testing and use average balances for specific ratios, such as when calculating accounts payable turnover.

Income Statement
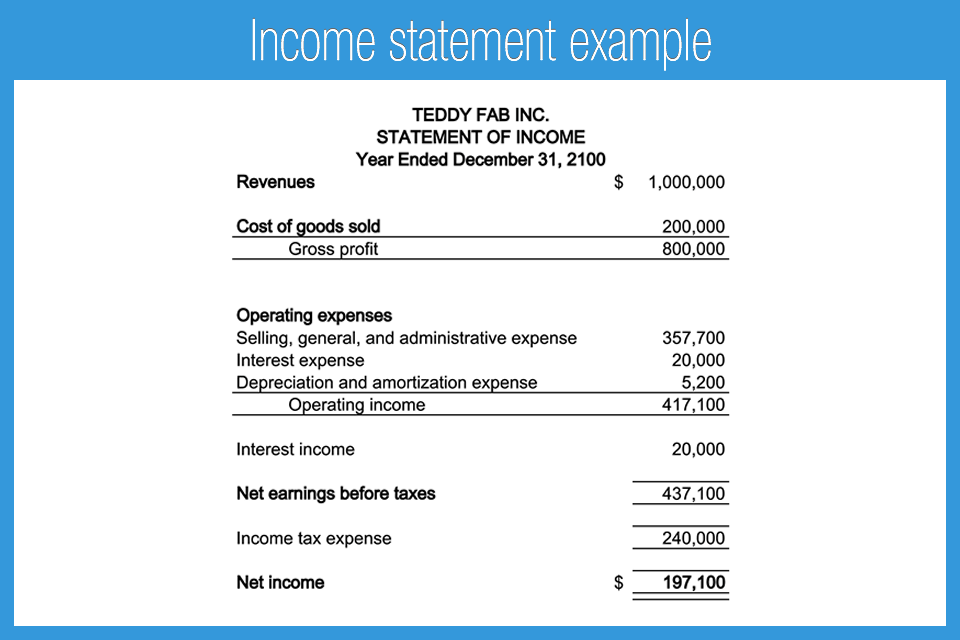
Income statement ratios are based on a period of time and the resulting calculations will be heavily dependent on the time period selected. Seasonal businesses such as resorts or gift based businesses will have large fluctuations depending on the time of year. A ski resort may have losses in summer and booming profits in winter. Analysts must therefore understand limitations of ratios based upon the given time period and adjust their conclusions. Several different points in time and time periods for analysis may be used to see how a business is changing over time. Comparing ratios over a number of reporting periods, such as 3-5 years is a standard practice. This is known as trend analysis and may be both represented in numeric and graphical formats. Users will look for standard trends to see whether a business is improving or declining over several different areas of performance.
Industry Specific
The same ratio calculations can have a different meaning or interpretation depending on the target company’s industry. It is therefore important for the user to properly understand specific details about that industry. For example, an accounting firm is not the same as an office furniture manufacturer. The distinctions need to be understood when applying ratios. Ratios are a tool for analysis and likely have limited value unless all facts and circumstances are considered.
AccountingPlay Apps
Learn Accounting Faster and Easier
Learn financial accounting, debits & credits, and business tax easier with flashcards, mobile apps, and games. Learn accounting anytime and anywhere. AccountingPlay will help you learn in a fast and fun way. Available on iOS and Android


Premium Courses
One Time Payment. Lifetime Access.
Learn more comprehensive about debits and credits, financial accounting, excel fundamentals, business tax prep & plan, CPA tax prep, and how to start and grow your business right. Get access to all of our books, spreadsheets, academic papers, cheat sheet, audio vault, videos, and more.
Recommended Tools
One of your top priorities as a small business owner is keeping a close eye on the money you bring in and pay out, which is why it’s critical to have the right accounting software. You need a program that helps you accomplish your daily accounting tasks. Here are our best picks for tools we recommend and use
