- Accounting Topic
- Financial Ratios Topic
Operating Performance Ratios
Summary
Operating performance is defined as measuring results relative to the assets used to achieve those results. Efficiently for the purposes of this presentation could be defined as the ratio of output performed by a process or activity relative to the total required energy spent. This category is subjective in nature. Often measurements are viewed not only in relation to factors within a company but without it as well, which is done by making comparisons of company results to industry standards or benchmarks. Most often, making relative comparisons is the best way to fully understand results in this ratio category. In general this measurement tool is most often applied in a monetary or financial sense, though it also has applications in other areas such as regulatory compliance, ethics, and managing risk.
Understanding operating performance is critical in gauging the condition of a company. Consistently top-performing companies are always efficient operators, while poorly performing companies often have underlying issues which are creating poor results. Results will vary depending on the time period selected, but overtime should provide valuable performance insight.
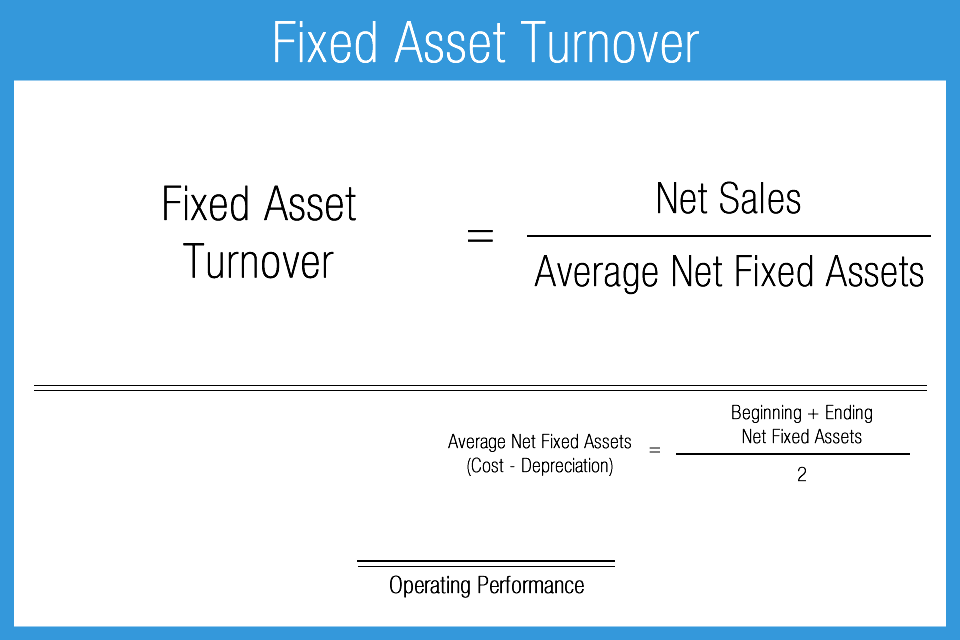
Fixed Assets Turnover Ratio
The fixed assets turnover ratio measures how efficiently or effectively a company employees its fixed assets to generate sales. Trend analysis is beneficial in making sense of this ratio. Ideally the user would like to see a rising trend which could indicate efficiency or less required investment for a given sales volume. Conversely, a ratio result in a declining trend could indicate overspending or issues on the revenue side. Factors such as book value, age of equipment or, less often, different capital structures or strategic differences in methods of production may make industry comparison difficult.
- Measures relationship between sales and fixed assets
- Generally favorable: higher result
- Measure of: activity and efficiency
- Indicates how well a company utilizes property, plant & equipment to generate revenue
Sales or Revenue per Employee
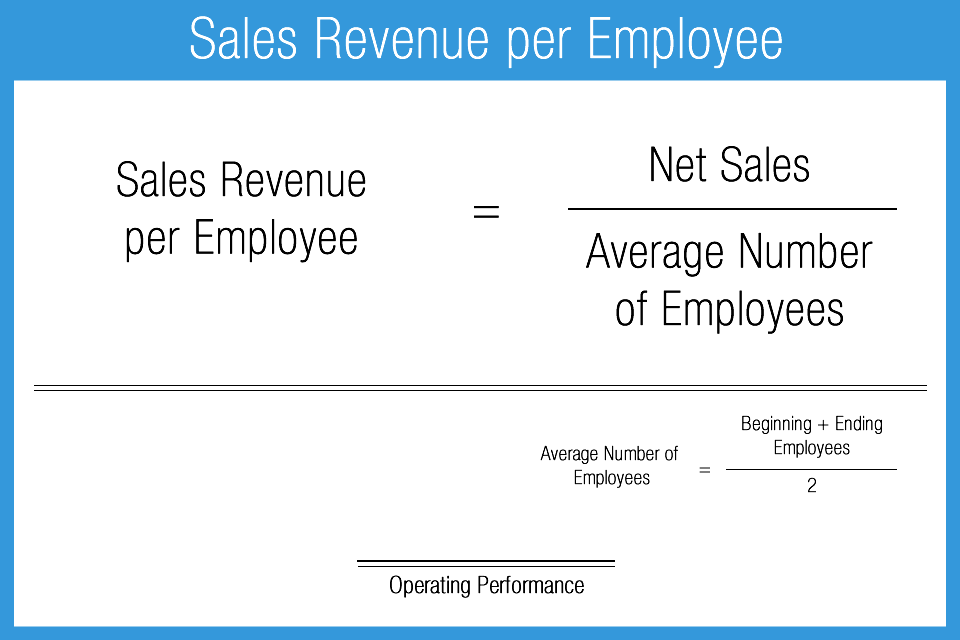
Sales or revenue per employee uses average employee figures for the reporting period analyzed compared to sales. Ratio results are highly divergent and are driven by industry and strategic management choices. Trend analysis is helpful to gain insight into any operational or efficiency changes, or impacts from changes in strategy within a given company. Peer comparison is particularly important, as business type and size will substantially affect the ratio.
- Indicates revenue generated per employee
- Generally favorable: higher result
- Measure of: activity and efficiency
- Heavily influenced by: industry type, production, and operating strategy
- Best used with: trend analysis
Operating Cycle
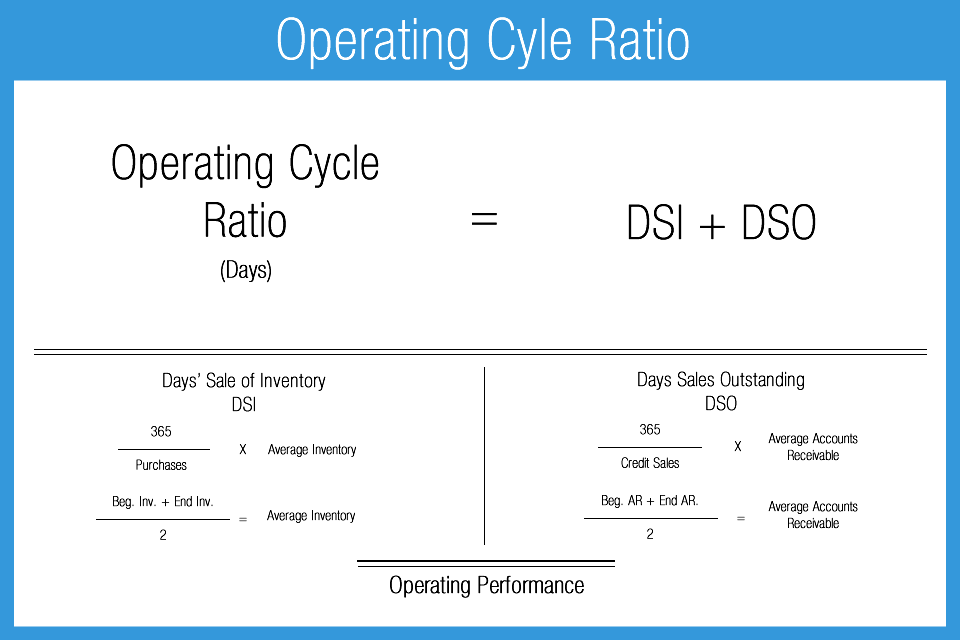
The operating cycle is a concept that estimates the average the number of days a company takes to convert inventory to cash by combining the impacts of both the time taken to sell inventory and the time taken to collect cash from accounts receivable. It represents the completed production process.
Generally speaking, at least with regard to this and other conversion ratios, companies purchase inventory or raw materials on credit and later sell products on credit. These actions result in accounts payable and accounts receivable. Therefore, the actual transfer of cash, in either direction, does not come into play until the company pays payables and collects receivables. The ratio is a measure of operating efficiency and working capital management. The shorter the time required to complete the cycle, the better.
- Measures time in days to convert inventory to cash
- Generally favorable: shorter result
- Includes impact of receivables collection
- Measure of: operating efficiency and working capital management
- Best used with: peer comparison
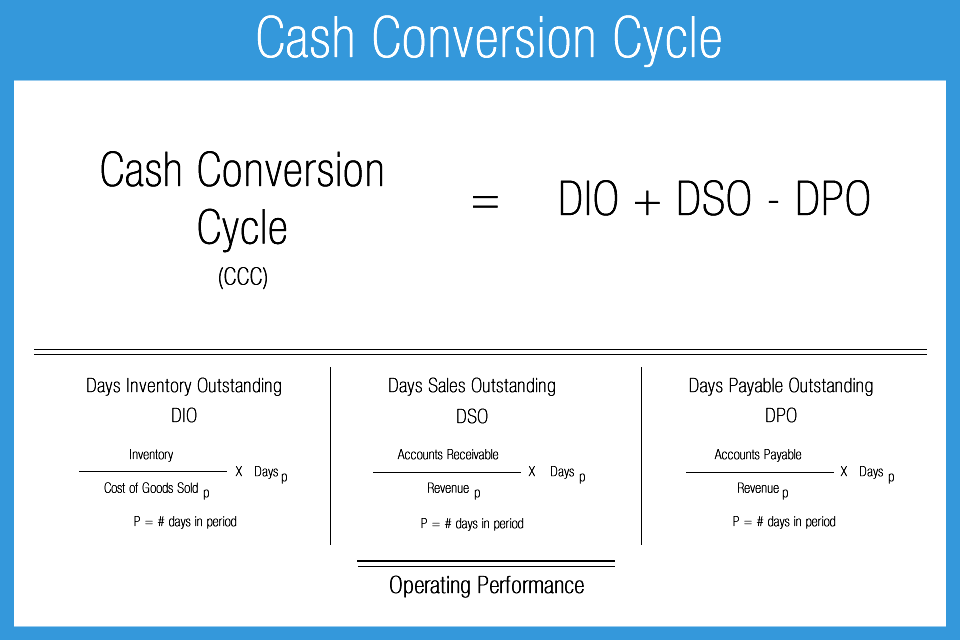
Cash Conversion Cycle
The cash conversion cycle measures the time between cash outflows and cash inflows resulting from the primary business line, or production process. In other words, it illustrates how quickly a company can convert its products into cash through sales. The shorter the cycle, the less time capital is tied up in the business process, and thus the better for earnings.
- Measures the time to convert resources into cash
- Generally favorable: shorter result
- Indicator of working capital efficiency
- Best used with: peer comparison
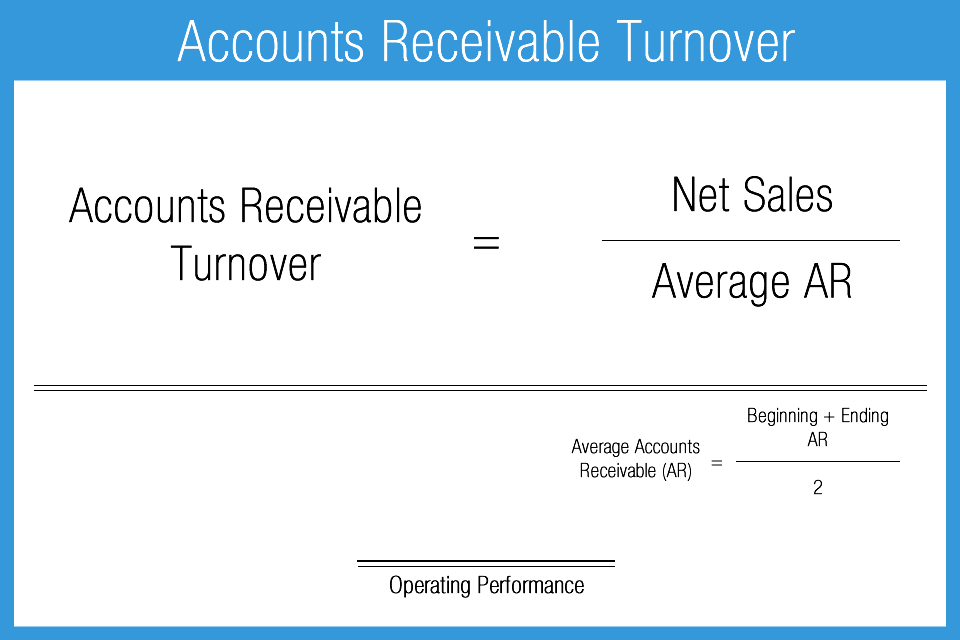
Account Receivable Turnover Ratio
Accounts receivable turnover gives an average for the number of times (expressed in days) that a company takes to collect its outstanding receivables. Similar turnover ratios can be expressed in either number of times per year or days.
The AR turnover ratio is an indicator of operating efficiency. It measures the efficiency in money collection. Only sales made on credit are used in this evaluation because sales made on a cash basis are collected immediately. A high result indicates a company is collecting on receivables quickly. A low result indicates the opposite, and could be a sign the company needs to review slow paying customers.
- Calculates the average number of days required to collect receivables
- Generally favorable: shorter result
- Measure of: operating efficiency and working capital management
- Heavily influenced by: industry type
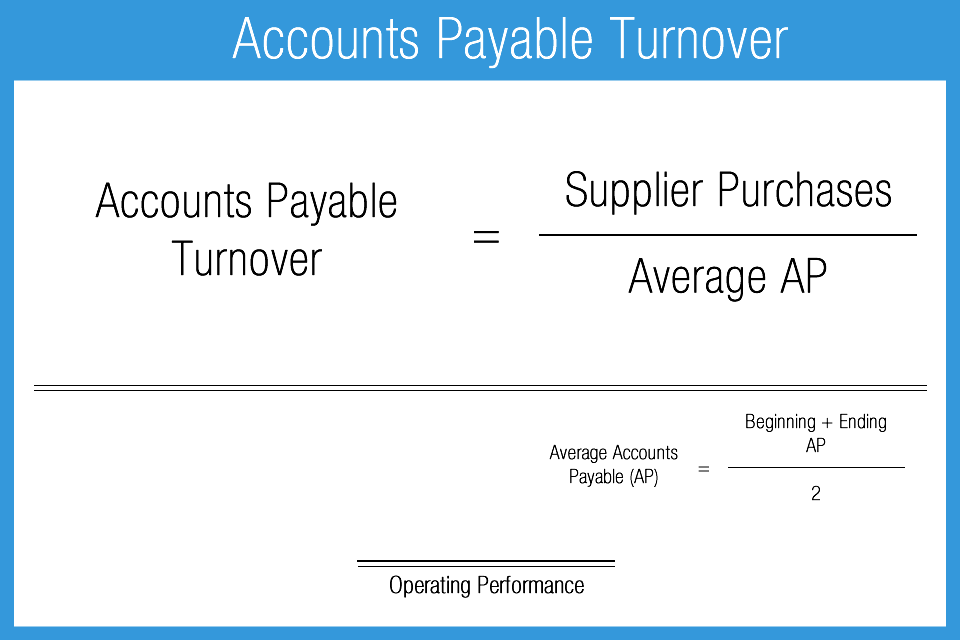
Accounts Payable Turnover Ratio
The principles underlying the accounts payable turnover ratio are the same as for the accounts receivable turnover ratio, with the exception that accounts payable (liability account) is being addressed. It also is an indicator of operating efficiency, demonstrating the degree to which a company can pay its short-term obligations in a timely manner.
This ratio is of primary interest to both suppliers and lenders. Lower numbers are almost always better. Companies that pay quickly can often benefit by better terms or receive discounts. However, if the turnover result is exceptionally low it might indicate a company is paying too quickly. Paying too fast can be a loss of opportunity for a company to make money on existing savings. Paying too quick may also force a company to use more high interest credit lines which increase interest expense.
- Calculates the average rate at which payables are paid
- Generally favorable: shorter result
- Measure of: operating efficiency and working capital management
- +/- 45 Days considered reasonable
- Heavily influenced by: industry type
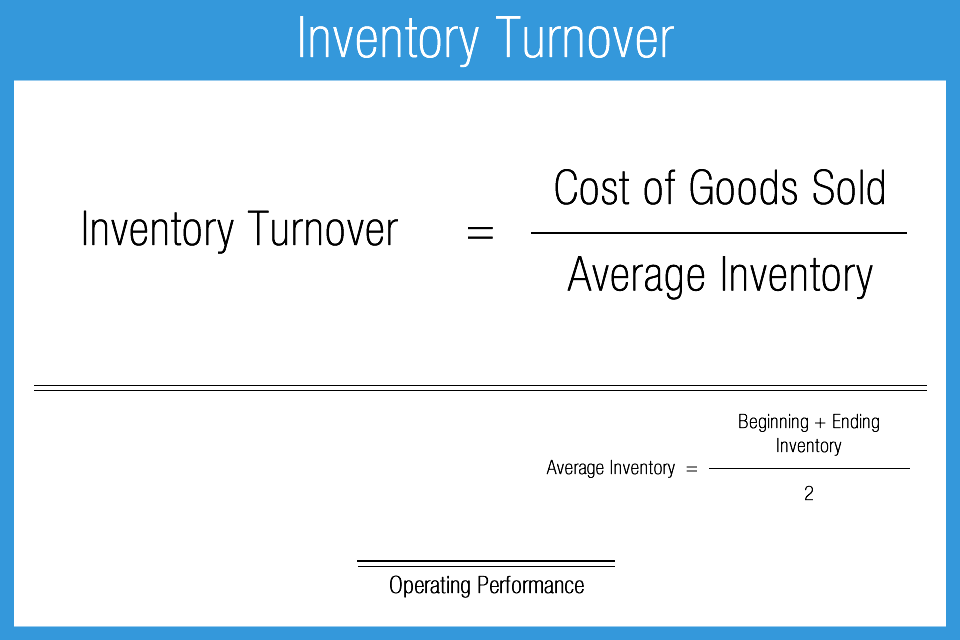
Inventory Turnover Ratio
Inventory turnover provides the average number of times inventory is sold during a reporting period. The ratio can be expressed either by the number of times during the period, or by the number of days. As with every turnover ratio, this is a measure of efficiency in operations. The quicker a company can sell its inventory, the better. Quicker turnover allows for more opportunities to generate profit, indicates that the company is selling a desired product, and reduces the chance of spoilage, obsolescence or the need to offer discounts. The ratio result is significantly influenced by industry type. For example, you should expect a local bakery to have a higher turnover compared to manufacturer of cruise ships.
- Calculates frequency of inventory sold on average, during a reporting period
- Generally favorable: shorter result
- Measure of: operating efficiency and working capital management
- Heavily influenced by: industry type
AccountingPlay Apps
Learn Accounting Faster and Easier
Learn financial accounting, debits & credits, and business tax easier with flashcards, mobile apps, and games. Learn accounting anytime and anywhere. AccountingPlay will help you learn in a fast and fun way. Available on iOS and Android


Premium Courses
One Time Payment. Lifetime Access.
Learn more comprehensive about debits and credits, financial accounting, excel fundamentals, business tax prep & plan, CPA tax prep, and how to start and grow your business right. Get access to all of our books, spreadsheets, academic papers, cheat sheet, audio vault, videos, and more.
Recommended Tools
One of your top priorities as a small business owner is keeping a close eye on the money you bring in and pay out, which is why it’s critical to have the right accounting software. You need a program that helps you accomplish your daily accounting tasks. Here are our best picks for tools we recommend and use
