Valuation Ratios

Summary
Valuation ratios in this sense are concerned with identifying the value component of securities investment vehicles behind companies. These are most often used by people who participate in the securities markets (stock market and equity sales). From this perspective, a range of users would include those employed in the industry such as portfolio managers or investment analysts, down to smaller participants like individual investors. In general, these users are looking to make either investment decisions or recommendations. Valuation is an important concept mostly because its serves as a foundational component for determining the actual cost or price of an investment. It provides a way to measure the relative value of an investment against alternative options.
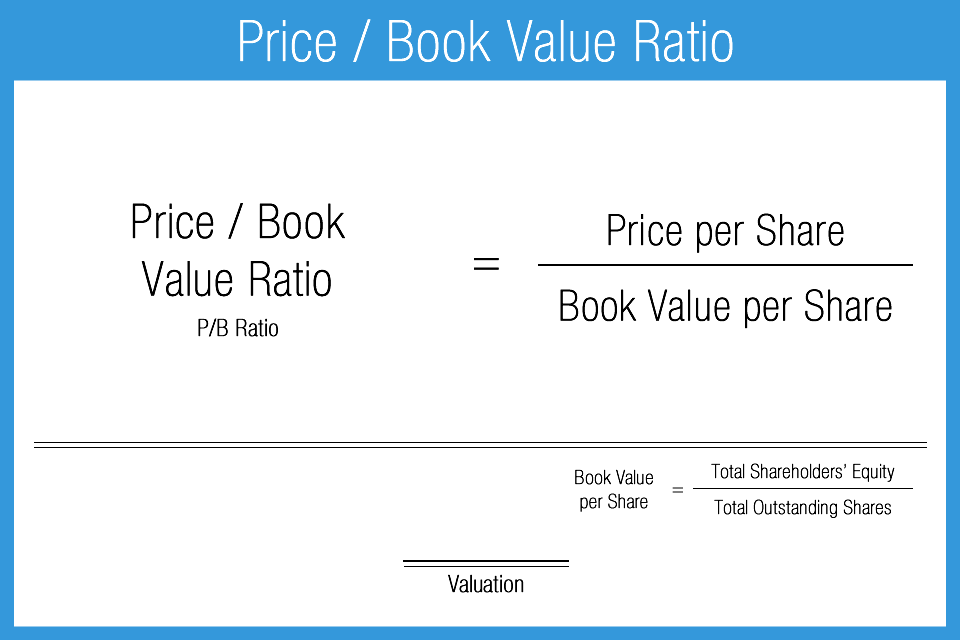
Price/Book Value Ratio
Price/book value ratio (price to book or P/B ratio) compares current market value to current book value. Market value is the current value of the company in the stock market, while book value is the difference between reported assets and reported liabilities for a given period. This is most often expressed in terms of per share values. The P/B ratio is an indication of the inherent value of a company. Note that some formula calculations will exclude intangible assets when calculating book value, which is referred to as the price to tangible book ratio.
Price to book is a very simplistic method of identifying attractive investment opportunities. A lower P/B ratio can mean either the stock is undervalued or something is fundamentally wrong with the company. In other words, the ratio by itself does not explain the “why” behind the result. This ratio gives you an idea if you’re paying too much for what would be left if the company declared bankruptcy.
P/B ratio is particularly useful for value investors, who are always on the hunt for low price stocks that the market has neglected. A P/B result of less than 1.0x generally means either the market believes the asset value is overstated, or the company is underperforming from an earnings perspective.
The ratio has several different limitations. It is mostly relevant for capital-intensive companies, financial institutions or other asset heavy companies. Book value does not account meaningfully for considerations such as goodwill, brand identity, new potential innovations, intellectual properties and any potential capital appreciation of certain assets. High leverage can also artificially distort the ratio because of the level of liabilities. Additionally, a newer company with historical reported losses and negative equity will have negative book value, but could be poised for profitability going forward.
- Compares market price of stock relative to book value
- Limited valuation measure that does not take into account several other possible valuation factors: appreciation of book value assets, market environment, income growth
- A value > 1.0x indicates favorable investor sentiment, a value < 1.0 indicates the opposite
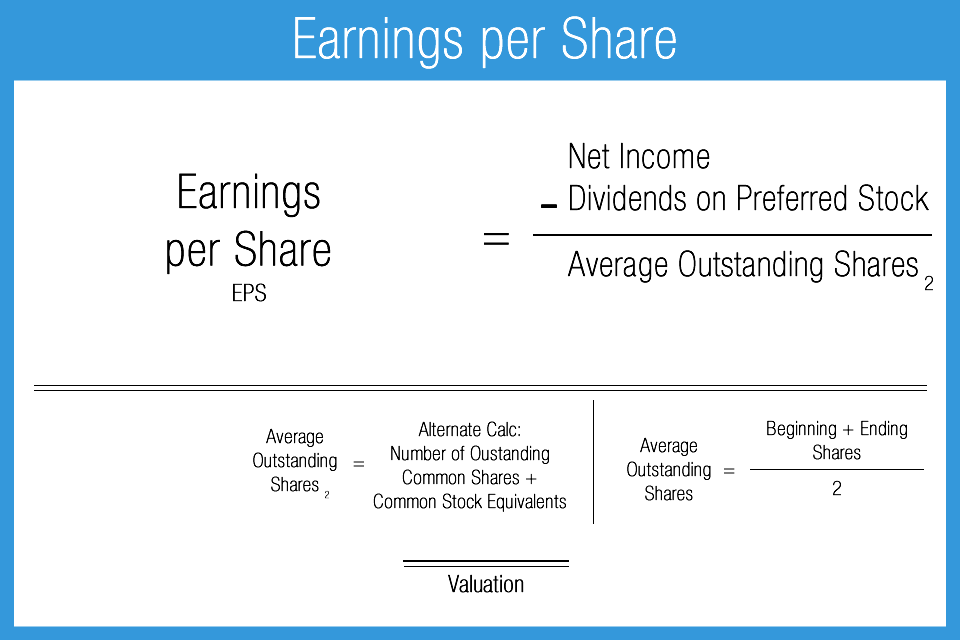
Earnings per Share
Earnings per share (EPS), is the most commonly expressed, and most important, measure of company valuation. EPS is generally regarded as the single most significant factor for influencing a company’s stock price, either upward or downward. A higher ratio result is always better. From an investment perspective, this ratio is highly significant and less important from a lender perspective.
EPS is also often calculated on a fully diluted basis, which accounts for the potential of additional shares from sources such as options, warrants and convertible securities. This calculation is generally considered the more accurate method. This metric is best evaluated in comparison to other companies in the same industry as well as over time using trend analysis.
- Presents earnings (net income) per single share of common stock
- Generally favorable: higher result
- Measure of: profitability and valuation
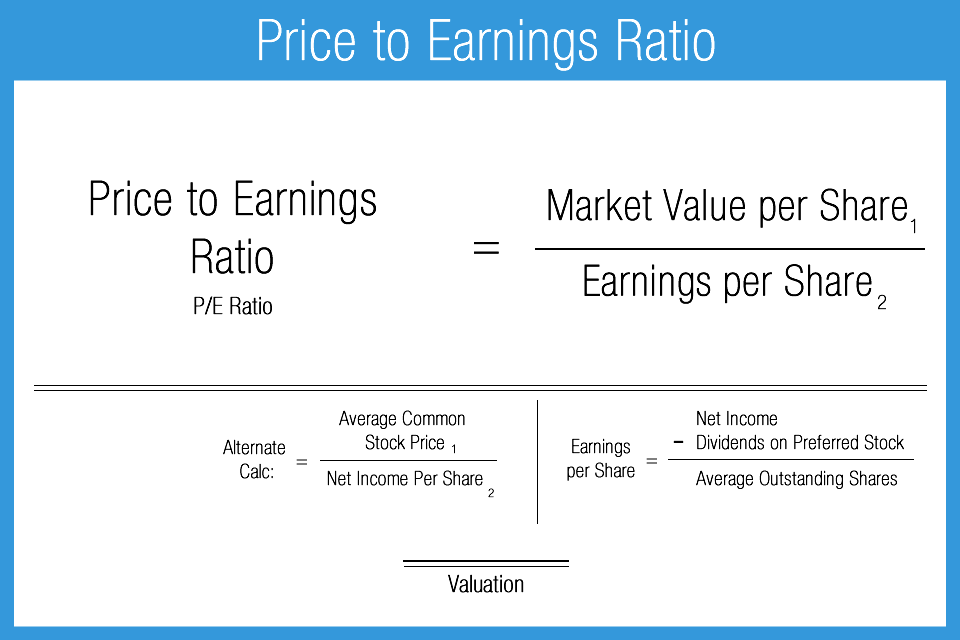
Price to Earnings per Share
Also known as the P/E Ratio, this metric is extremely popular among investors. The calculation shows the relation between the market price of a stock and the underlying earnings on a per share basis. The measure shows how expensive a stock is in relative terms to the market price. The ratio effectively shows how much investors are willing to pay per dollar of company earnings. It is useful for comparing investment opportunities between companies within an industry segment, and even between different industries. The P/E Ratio is traditionally calculated using the previous 12 month historical earnings and can also be calculated using 12 month projected earnings. If using forward earnings, the ratio is then known as forward P/E.
If there is a drawback to this ratio it would be that the denominator is based (usually) on historical reported earnings, which can be manipulated or skewed either by proper accounting convention or even fraudulent reporting. Thus, it is important for the user to understand the quality of the earnings reported.
- Compares common stock price per share to its earnings per share
- The higher the ratio, the more “expensive” the stock
- Higher results can indicate greater market demand
- Measure of: valuation
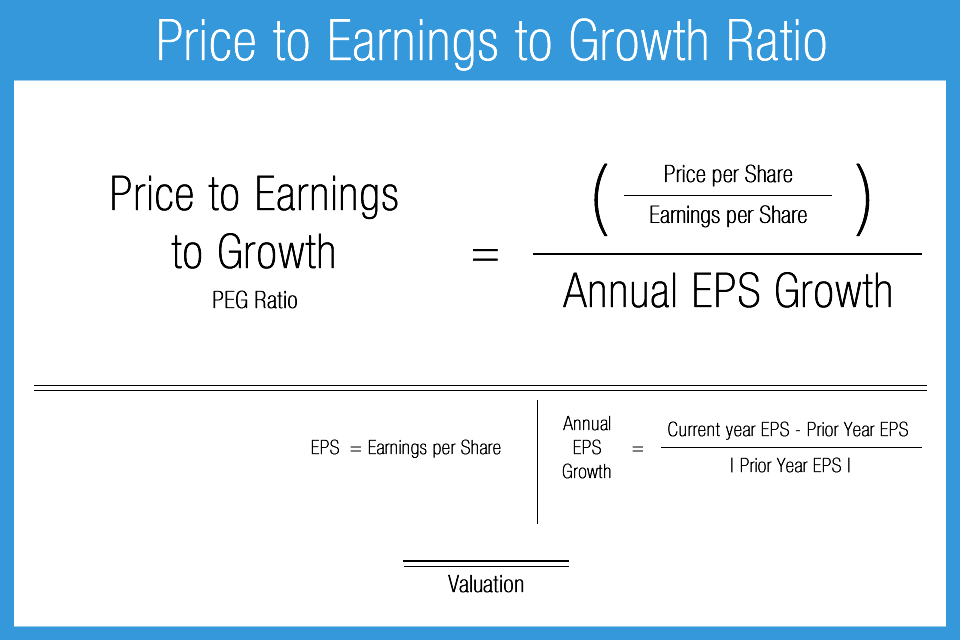
Price/Earnings to Growth Ratio
Price/earnings to growth ratio (PEG) takes into account company earnings growth in evaluating potential investment opportunities. Because the metric adds a growth component, it is considered more complete than the standard price/earnings ratio. Investors may look to see if a stock is under or overvalued and make decisions accordingly.
- Determines the value of common stock by taking earnings growth into account
- Measure of: valuation
- General guideline: if the resulting value < 1.0x a company is potentially undervalued
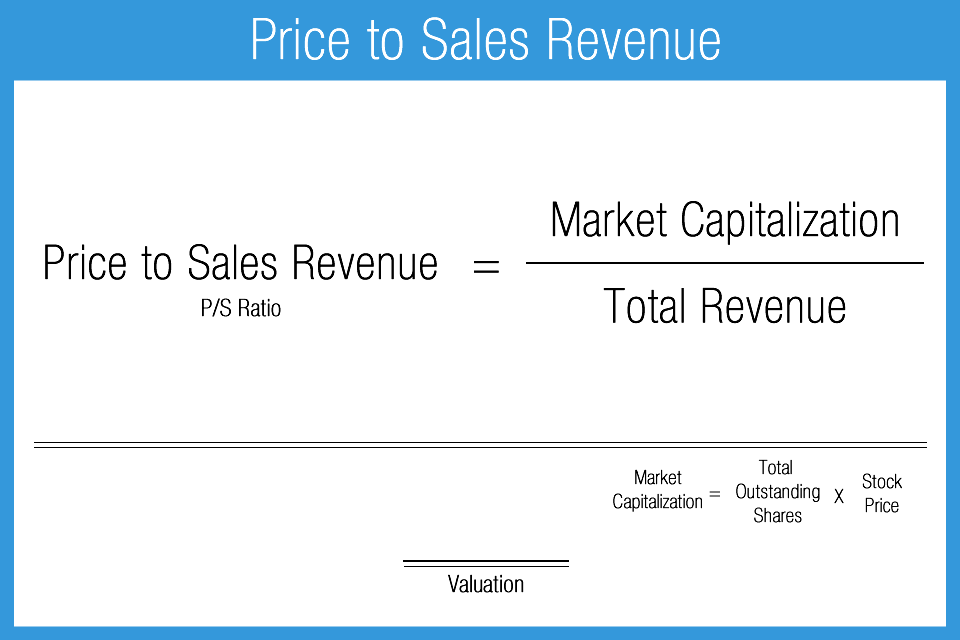
Price/Sales Ratio
The price to sales ratio (P/S) relates the company price per share to sales. The benefit to the approach is that it provides a method for evaluating potential investment opportunities among companies that are operational but not yet profitable. Such a company could be newer and still operating at a loss. The drawback is the highly limited nature of the calculation, in particular the exclusion of earnings quality or cash flow generation. It is useful for comparing similar stage companies within the same industry sector.
- Compares the value of common stock relative to sales volume
- Generally favorable: lower result
- Measure of: valuation
- Useful for evaluating newer companies with sales, but no earnings to date
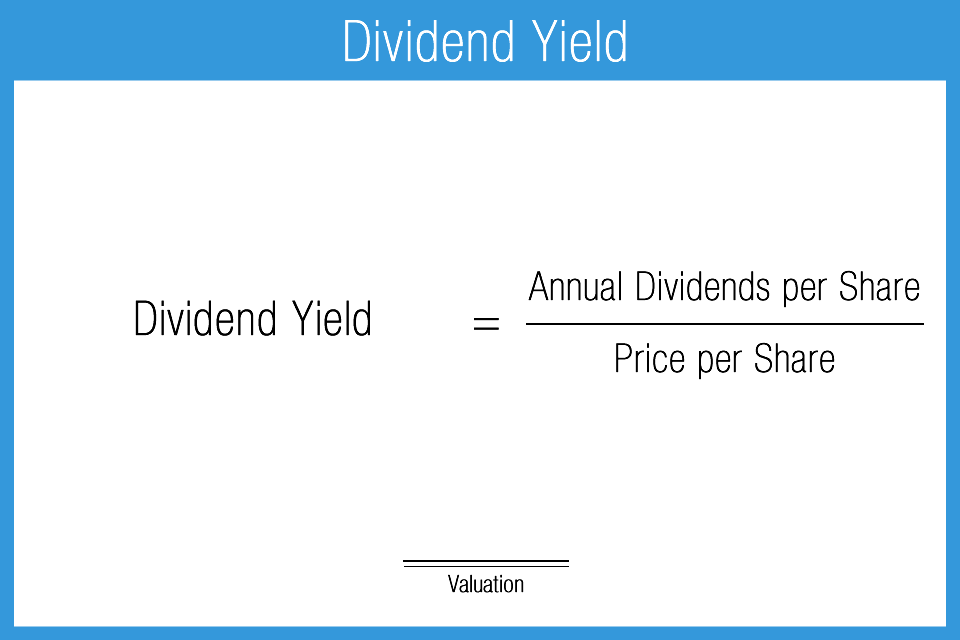
Dividend Yield Ratio
The dividend yield ratio calculates the ratio between dividends received relative to a company’s stock price. The objective is to illustrate what relative percentage an investor can expect to receive from dividends, compared to the stock’s purchase price. This metric is important to equity investors that prefer income producing stocks (as opposed to growth-oriented equity investors).
- Comparison of dividends paid relative to stock price
- Measure of: valuation and income (for investors)
- Less valuable for growth investors
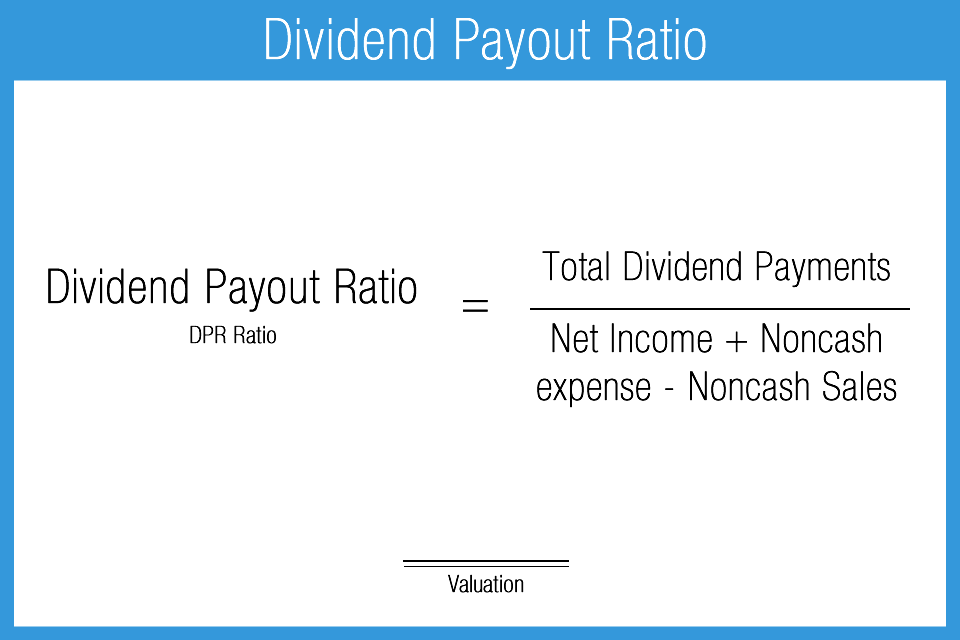
Dividend Payout Ratio
The dividend payout ratio simply shows the relationship between dividends paid and net income for a given reporting period. The ratio can be evaluated relative to historical dividend payout rates, management’s stated goals regarding dividends, peer results, and dividend related decisions.
A positive result indicates earnings are sufficient to cover dividends paid. That is the expected scenario if a company is paying dividends. A negative result means that current earnings are not sufficient to support the current level of dividend payout. This is not ideal and indicates adjustments in dividend policy or operations (or both) are necessary.
Trend analysis is helpful in determining the consistency of the ratio over time, which can be compared to actual payouts as well as management’s philosophy regarding dividends. This metric is relevant to dividend paying companies. New companies are less likely to pay dividends, generally choosing instead to reinvest earnings back into the company to support future growth.
- Measures dividends paid relative to net income
- An indicator of profitability, but not exclusively
- Result is highly company-specific
- If too high, it may indicate the payout rate is unsustainable or management is having issues employing capital
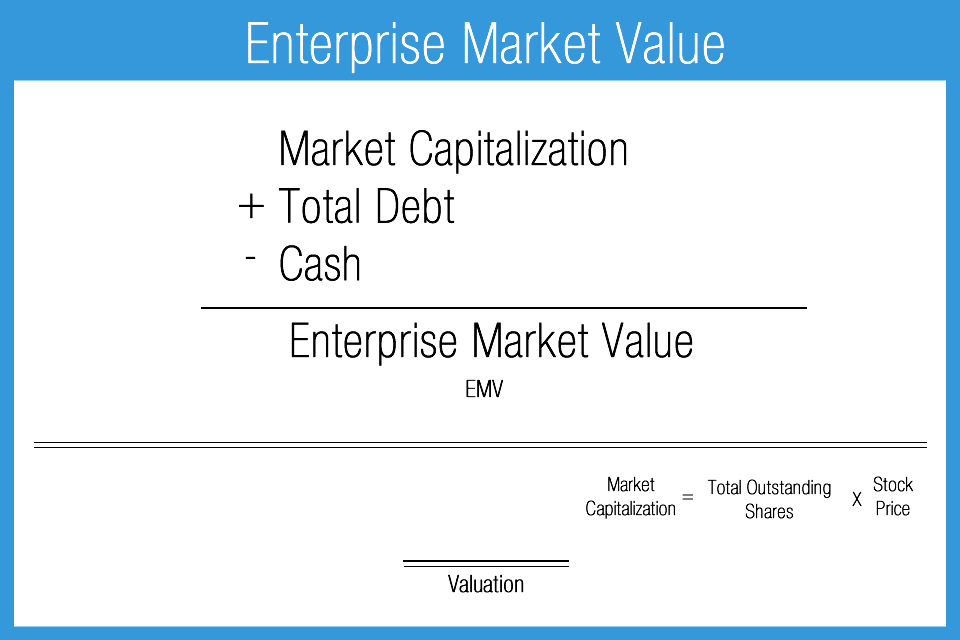
Enterprise Market Value
Enterprise market value is a simple method for making quick valuation assessments of a company, viewing it as an entire economic entity or enterprise and doing so from an acquisition perspective. Other standard metrics may include market capitalization which is simply the aggregate value of its common stock shares outstanding. Generally speaking, many adjustments are made during an acquisition process but this ratio simplifies the issue using a “quick and dirty” methodology, only adjusting for outstanding debt and cash. In an acquisition, acquiring debt would increase the cost of acquisition but cash holdings would reduce the cost of acquisition. This ratio accounts for these two factors. The ratio can only be considered as a quick estimate of acquisition cost at best and the user should never expect to rely solely on this approach when seriously pursuing acquisition targets. This is only one metric in the analysis, due diligence, and negotiation required of a business sale.
- Represents the entire economic value of a company
- Measure of: valuation
- Gives a theoretical “takeover price”
- Highly dependent on company fundamentals